


—A Review of the United States Real Estate Economy from 2006-2017—
IRVINE, Calif. — (BUSINESS WIRE) — March 1, 2018 — CoreLogic® (NYSE: CLGX), a leading global property information, analytics and data-enabled solutions provider, today released “Evaluating the Housing Market Since the Great Recession.” This report details the remarkable 11-year economic cycle surrounding the last U.S. housing market downturn, examining the boom and bust years between 2006 and 2011 and the ensuing recovery, with data through December 2017.
This press release features multimedia. View the full release here: http://www.businesswire.com/news/home/20180301005425/en/
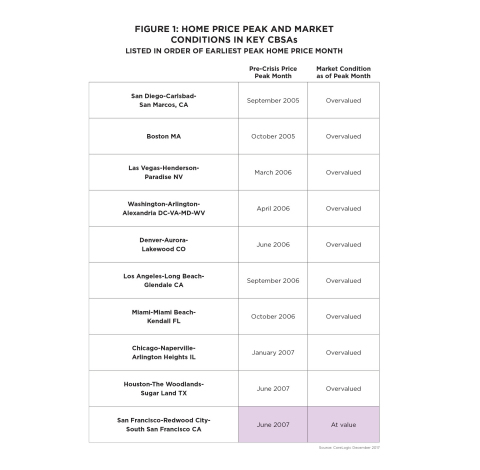
Figure 1: Home Price Peak and Market Conditions in Key Markets (Graphic: Business Wire)
Residential home prices began to peak in some parts of the country as early as 2005 (Figure 1). Home prices collapsed in 2007 (Figure 2), when Wall Street began to back out of residential mortgage-backed securities. After falling 33 percent during the recession, prices in most markets have returned to peak levels, growing 51 percent nationally since bottoming out in March 2011. The average home price is now 1 percent higher than it was at the peak in 2006, and the average year-over-year home equity gain was $14,888 in the third quarter of 2017*. This indicates the housing market has widely recovered.
While the nation’s average home price has stabilized, not all of the 50 states are back to their pre-recession price levels. Nevada suffered the biggest drop during the recession, with a 60 percent peak-to-trough decline in home prices (Figure 3). Even after experiencing a 93 percent increase from its trough-to-current home price level, Nevada home prices are still 23 percent below the pre-recession peak, and 9 percent of mortgaged properties remained underwater in the third quarter of 2017.
Some states faired relatively well through the national housing downturn, with 10 posting peak-to-trough declines of less than 10 percent. North Dakota’s peak-to-trough decline was the smallest at 2 percent. Due in part to the energy boom, North Dakota home prices have risen 48 percent above the prior peak in July 2008. Similarly, Nebraska and Iowa home prices both dropped by 5 percent during the recession. Nebraska now stands 27 percent higher than its lowest home price level during the recession, and Iowa is now 15 percent above its prior peak in 2006.
“Homeowners in the United States experienced a run-up in prices from the early 2000s to 2006, and then saw the trend reverse with steady declines through 2011,” said Dr. Frank Nothaft, chief economist for CoreLogic. “After reaching bottom in 2011, our national price index is up more than 50 percent. West Coast states, such as California, Washington and Oregon are seeing some of largest trough-to-current growth rates in home prices. Greater demand and lower supply – as well as booming job markets – have given some of the hardest-hit housing markets a boost in home prices. Yet, many are still not back to pre-crash levels.”
Local job market dynamics and other factors helped determine the severity of the housing downturn at the regional level. Las Vegas, Miami and Chicago each arrived at their respective peaks at different times during the boom and experienced significant peak-to-trough home price declines during the recession. These markets have been slower to recover and their home prices are below their pre-recession peaks. Other metro areas such as San Francisco and Denver, which both have technology sectors and low unemployment, have experienced consistent home price growth. In the third quarter of 2017, the average year-over-year equity gain in San Francisco and Denver was $73,217, and $22,102, respectively, and only 1 percent of homes in those markets remained underwater.
*December 2017 equity data was revised. Revisions are standard, and to ensure accuracy CoreLogic incorporates newly released data to provide updated results.
Methodology
The data in this report represents home price activity reported through December 2017 and home equity data through the third quarter of 2017.
The CoreLogic HPI™ is built on industry-leading public record, servicing and securities real-estate databases, and incorporates more than 40 years of repeat-sales transactions for analyzing home price trends. Generally released on the first Tuesday of each month (with an average five-week lag), the CoreLogic HPI is designed to provide an early indication of home price trends by market segment and for the “Single-Family Combined” tier. The report represents the most comprehensive set of properties, including all sales for single-family attached and single-family detached properties. The indexes are fully revised with each release and employ CoreLogic valuation techniques to signal turning points in the market sooner than other reports. The CoreLogic HPI provides measures for multiple market segments (referred to as tiers) based on property type, price, time between sales, loan type (conforming vs. non-conforming) and distressed sales. Broad national coverage is available from the national level down to ZIP Code, including non-disclosure states.
CoreLogic Market Condition Indicators (MCI)
analysis categorizes home prices in individual markets as undervalued,
at value or overvalued. The MCI analysis defines an overvalued housing
market as one in which home prices are at least 10 percent higher than
the long-term, sustainable level. It defines an undervalued housing
market as one in which home prices are at least 10 percent below the
sustainable level.


 Animation, 3D Art and 3D Models")