- Overall delinquency remains elevated compared to 2019, but is down from September
- Lake Charles, Louisiana, continues with highest delinquency rates after Hurricane Laura
IRVINE, Calif. — (BUSINESS WIRE) — January 12, 2021 — CoreLogic® (NYSE: CLGX), a leading global property information, analytics and data-enabled solutions provider, today released its monthly Loan Performance Insights Report for October 2020. On a national level, 6.1% of mortgages were in some stage of delinquency (30 days or more past due, including those in foreclosure). This represents a 2.4-percentage point increase in the overall delinquency rate compared to October 2019, when it was 3.7%. Notably, serious delinquency is over three times that of October 2019, but down from the previous two months.
This press release features multimedia. View the full release here: https://www.businesswire.com/news/home/20210112005309/en/

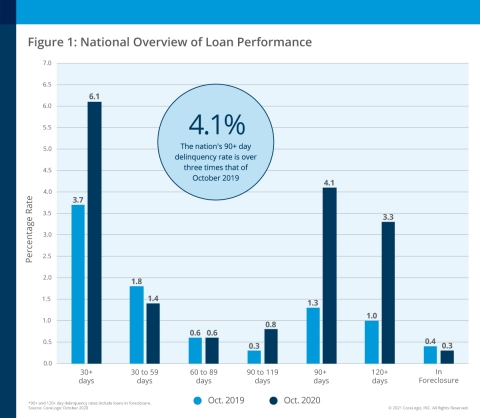
CoreLogic National Overview of Mortgage Loan Performance, featuring October 2020 Data (Graphic: Business Wire)
To gain an accurate view of the mortgage market and loan performance health, CoreLogic examines all stages of delinquency, including the share that transitions from current to 30 days past due. In October 2020, the U.S. delinquency and transition rates, and their year-over-year changes, were as follows:
- Early-Stage Delinquencies (30 to 59 days past due): 1.4%, down from 1.8% in October 2019.
- Adverse Delinquency (60 to 89 days past due): 0.6%, unchanged from 0.6% in October 2019.
- Serious Delinquency (90 days or more past due, including loans in foreclosure): 4.1%, up from 1.3% in October 2019, but down slightly from 4.2% in September and 4.3% in August.
- Foreclosure Inventory Rate (the share of mortgages in some stage of the foreclosure process): 0.3%, down from 0.4% in October 2019. The foreclosure rate has stayed at 0.3% for seven consecutive months, which was the lowest since at least January 1999.
- Transition Rate (the share of mortgages that transitioned from current to 30 days past due): 0.8%, up from 0.7% in October 2019.
Job loss and increased closures of small businesses triggered higher delinquency rates during the pandemic. A record amount of home equity, and the CARES Act loan forbearance, have helped to keep borrowers out of foreclosure, leading to a decline in the foreclosure rate despite high delinquency rates.
“After a financially challenging year, the healthy housing market and new stimulus measures are helping borrowers get back on their feet,” said Frank Martell, president and CEO of CoreLogic. “Given these variables, we should begin to see a reduced flow of homes in delinquency in the coming months.”
“During early autumn, the improving economy enabled more families to remain current on their home loan,” said Dr. Frank Nothaft, chief economist at CoreLogic. “In September and October, 0.8% of current borrowers transitioned into 30-day delinquency. This is the same as the monthly average for the 12 months prior to the pandemic, and well below the record peak of 3.4% of borrowers transitioning into delinquency that we observed in April 2020.”
In October, every state logged an annual increase in overall delinquency rates, with Hawaii (up 4.7 percentage points) and Nevada (up 4.6 percentage points) again topping the list for gains in October. Hawaii began lifting travel restrictions in mid-October, so we may see the growth of tourism reverse some of the economic effects of the pandemic.
Similarly, nearly all U.S. metro areas logged an increase in overall delinquency rates in October. Lake Charles, Louisiana — which was severely impacted by Hurricane Laura in August — experienced the largest annual increase for the second consecutive month with 11 percentage points. Other metro areas with significant overall delinquency increases included Odessa, Texas (up 10.3 percentage points); Kahului, Hawaii (up 7.8 percentage points) and Midland, Texas (up 7.5 percentage points).
The next CoreLogic Loan Performance Insights Report will be released on February 9, 2021, featuring data for November 2020. For ongoing housing trends and data, visit the CoreLogic Insights Blog: www.corelogic.com/insights.
Methodology
The data in The CoreLogic LPI report represents foreclosure and delinquency activity reported through October 2020. The data in this report accounts for only first liens against a property and does not include secondary liens. The delinquency, transition and foreclosure rates are measured only against homes that have an outstanding mortgage. Homes without mortgage liens are not subject to foreclosure and are, therefore, excluded from the analysis. CoreLogic has approximately 75% coverage of U.S. foreclosure data.
Source: CoreLogic
The data provided is for use only by the primary recipient or the primary recipient's publication or broadcast. This data may not be re-sold, republished or licensed to any other source, including publications and sources owned by the primary recipient's parent company without prior written permission from CoreLogic. Any CoreLogic data used for publication or broadcast, in whole or in part, must be sourced as coming from CoreLogic, a data and analytics company. For use with broadcast or web content, the citation must directly accompany first reference of the data. If the data is illustrated with maps, charts, graphs or other visual elements, the CoreLogic logo must be included on screen or website. For questions, analysis or interpretation of the data, contact Valerie Sheets at newsmedia@corelogic.com. Data provided may not be modified without the prior written permission of CoreLogic. Do not use the data in any unlawful manner. This data is compiled from public records, contributory databases and proprietary analytics, and its accuracy is dependent upon these sources.
About CoreLogic
CoreLogic (NYSE: CLGX), the leading provider of property insights and solutions, promotes a healthy housing market and thriving communities. Through its enhanced property data solutions, services and technologies, CoreLogic enables real estate professionals, financial institutions, insurance carriers, government agencies and other housing market participants to help millions of people find, buy and protect their homes. For more information, please visit www.corelogic.com.
CORELOGIC and the CoreLogic logo are trademarks of CoreLogic, Inc. and/or its subsidiaries. All other trademarks are the property of their respective owners.
View source version on businesswire.com: https://www.businesswire.com/news/home/20210112005309/en/
Contact:
Valerie Sheets
CoreLogic
newsmedia@corelogic.com


