- Twenty-one states logged a small annual gain in overall delinquency rate
- Some hurricane and wildfire areas in the Southeast and California continue to log relatively high delinquency rates
IRVINE, Calif. — (BUSINESS WIRE) — June 11, 2019 — CoreLogic® (NYSE: CLGX), a leading global property information, analytics and data-enabled solutions provider, today released its monthly Loan Performance Insights Report. The report shows that nationally 4% of mortgages were in some stage of delinquency (30 days or more past due, including those in foreclosure) in March 2019, representing a 0.3-percentage-point decline in the overall delinquency rate compared with March 2018, when it was 4.3%. This was the lowest for the month of March in 13 years.
This press release features multimedia. View the full release here: https://www.businesswire.com/news/home/20190611005125/en/

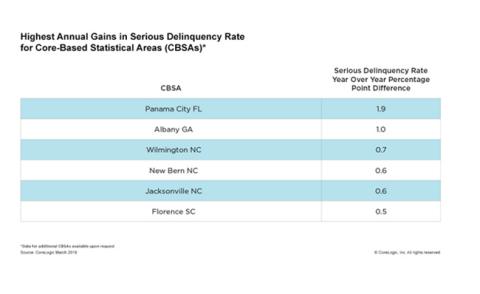
Highest Annual Gains in Serious Delinquency Rate for Core-Based Statistical Areas (CBSAs); CoreLogic March 2019 (Graphic: Business Wire)
As of March 2019, the foreclosure inventory rate – which measures the share of mortgages in some stage of the foreclosure process – was 0.4%, down 0.2 percentage points from March 2018. March 2019 marked the fifth consecutive month that the foreclosure inventory rate remained at 0.4% and was the lowest for any month since at least January 1999.
Measuring early-stage delinquency rates is important for analyzing the health of the mortgage market. To monitor mortgage performance comprehensively, CoreLogic examines all stages of delinquency, as well as transition rates, which indicate the percentage of mortgages moving from one stage of delinquency to the next.
The rate for early-stage delinquencies – defined as 30 to 59 days past due – was 2% in March 2019, up from 1.8% in March 2018. The share of mortgages 60 to 89 days past due in March 2019 was 0.6%, unchanged from March 2018. The serious delinquency rate – defined as 90 days or more past due, including loans in foreclosure – was 1.4% in March 2019, down from 1.9% in March 2018. The serious delinquency rate of 1.4% this March was the lowest for that month since 2006 when it was also 1.4%.
Since early-stage delinquencies can be volatile, CoreLogic also analyzes transition rates. The share of mortgages that transitioned from current to 30 days past due was 0.9% in March 2019, up from 0.7% in March 2018. By comparison, in January 2007, just before the start of the financial crisis, the current-to-30-day transition rate was 1.2%, while it peaked in November 2008 at 2%.
The nation's overall delinquency rate has fallen on a year-over-year basis for the past 15 consecutive months. However, 21 states did experience a slight increase in the overall delinquency rate in March 2019. Mississippi had the nation’s highest overall delinquency rate at 8.2%, a 0.5-percentage-point gain from March 2018, while Alabama’s gain was 0.3 percentage points. The other 19 states experienced annual gains of 0.1 or 0.2 percentage points.
“The increase in the overall delinquency rate in 42% of states most likely indicates many Americans were caught off guard by their expenses in early 2019,” said Dr. Frank Nothaft, chief economist at CoreLogic. “A strong economy, labor market and record levels of home equity should limit delinquencies from progressing to later stages.”
In March 2019, 166 U.S. metropolitan areas posted at least a small annual increase in the overall delinquency rate. Some of the highest gains were in several hurricane-ravaged parts of the Southeast (in Florida, Georgia and North Carolina), and in Northern California’s Chico metropolitan area, home of last year’s devastating “Camp Fire.”
“Delinquency rates and foreclosures continue to drop through March and should decline further in the months ahead barring any serious dislocations from recent flooding in the Midwest or a severe Atlantic hurricane and/or wildfire season on the coasts,” said Frank Martell, president and CEO of CoreLogic.
The next CoreLogic Loan Performance Insights Report will be released on July 9, 2019, featuring data for April 2019.
For ongoing housing trends and data, visit the CoreLogic Insights Blog: www.corelogic.com/insights.
Methodology
The data in this report represents foreclosure and delinquency activity reported through March 2019.
The data in this report accounts for only first liens against a property and does not include secondary liens. The delinquency, transition and foreclosure rates are measured only against homes that have an outstanding mortgage. Homes without mortgage liens are not typically subject to foreclosure and are, therefore, excluded from the analysis. Approximately one-third of homes nationally are owned outright and do not have a mortgage. CoreLogic has approximately 85% coverage of U.S. foreclosure data.
Source: CoreLogic
The data provided is for use only by the primary recipient or the
primary recipient's publication or broadcast. This data may not be
re-sold, republished or licensed to any other source, including
publications and sources owned by the primary recipient's parent company
without prior written permission from CoreLogic. Any CoreLogic data used
for publication or broadcast, in whole or in part, must be sourced as
coming from CoreLogic, a data and analytics company. For use with
broadcast or web content, the citation must directly accompany first
reference of the data. If the data is illustrated with maps, charts,
graphs or other visual elements, the CoreLogic logo must be included on
screen or website. For questions, analysis or interpretation of the
data, contact Chad Yoshinaka at
newsmedia@corelogic.com
or Allyse Sanchez at
corelogic@ink-co.com .
Data provided may not be modified without the prior written permission
of CoreLogic. Do not use the data in any unlawful manner. This data is
compiled from public records, contributory databases and proprietary
analytics, and its accuracy is dependent upon these sources.


