—Annual natural hazard summary from CoreLogic details another above-average year for wildfire and flood events—
IRVINE, Calif. — (BUSINESS WIRE) — January 17, 2019 — CoreLogic® (NYSE: CLGX), a leading global property information, analytics and data-enabled solutions provider, today released its annual Natural Hazard Report, which addresses the recent wildfires in California and severe rainfall- and hurricane-induced flooding throughout the nation as the leading catastrophes in 2018. Much like 2017, last year was an above-average year for hurricanes, flooding, wildfires and severe winds.
This press release features multimedia. View the full release here: https://www.businesswire.com/news/home/20190117005204/en/

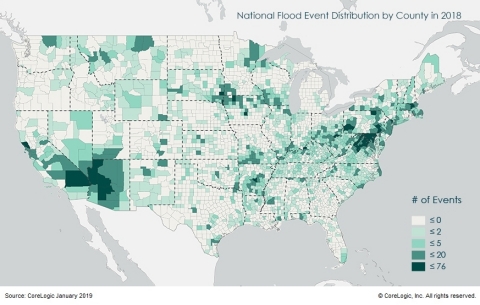
CoreLogic National Flood Event Distribution by County in 2018 (Graphic: Business Wire)
The annual report analyzes hazard activity in the U.S. including events for Atlantic and Pacific hurricanes, flooding, wind, wildfire, earthquake and volcano, hail and tornado, as well as several international events including typhoons and cyclones in Japan, Oman, Hong Kong and the Philippines.
“In 2018, the U.S. continued to experience damaging weather and natural catastrophes in high exposure areas, and in some instances, in regions that had been impacted in less than a year prior,” said Howard Botts, chief scientist, CoreLogic. “Hazards will always pose a real threat to homes and businesses and knowing exactly what that risk entails is critical to helping ensure sufficient protection from the financial catastrophes that so often follow natural disasters.”
Highlights from the analysis include:
Flooding
- In 2018, there were over 1,600 significant flood events that occurred in the U.S., 59 percent of which were flash flood-related.
- Residential and commercial flood damage in North Carolina, South Carolina and Virginia from Hurricane Florence is estimated at $19 billion to $28.5 billion, of which roughly 85 percent of residential flood losses was in fact, uninsured.
- Multiple states, including Texas, North and South Carolina, Maryland and Wisconsin, experienced 1,000-year floods; several of 2018’s floods occurred less than two years after the same areas’ previous 1,000-year flood events.
- Six percent of properties nationwide are within Special Flood Hazard Areas (SFHA), and approximately one-third of those have flood insurance policies.
Atlantic Hurricanes
- The 2018 Atlantic Hurricane season saw 15 named storms, eight of which were named hurricanes. Two of these, Hurricanes Florence (Category 1) and Michael (Category 4), made landfall along the U.S. This made 2018 the third back-to-back season of above-average hurricane activity in the Atlantic.
- Approximately 700,000 residential and commercial properties experienced catastrophic flooding and wind damage from Hurricane Florence, where it is estimated to have caused between $20 to $30 billion in insured and uninsured loss.
- Michael is the strongest hurricane to make landfall in the Florida Panhandle since 1900 and the strongest hurricane to make landfall in the U.S. since Hurricane Andrew in 1992. It is estimated to have caused $2.5 to $4 billion in residential and commercial insured loss from wind and storm surge.
Wildfire
- The number of acres that burned in 2018 is the eighth highest in U.S. history as reported through November 30, 2018.
- A total of 11 western states had at least one wildfire that exceeded 50,000 burned acres; the leading states were California and Oregon, each with seven fires that burned more than 50,000 acres.
- The November 2018 Camp Fire in Northern California destroyed nearly the entire city of Paradise and brought damage or destruction to 18,804 structures (NIFC, 2018).
- The Woolsey wildfire in the coastal community of Malibu destroyed more than 1,600 structures (Los Angeles County Fire Dept, 2017).
- CoreLogic estimates that the combined total insured and uninsured loss for these two wildfires is between $15 billion and $19 billion.
For an interactive version of the 2018 Natural Hazard Report, which includes maps, charts and images, visit this link.
To take a deeper look at CoreLogic coverage of 2018 natural disasters,
visit the company’s natural hazard risk information center, Hazard HQ <


